NZ Curriculum Achievement Objectives for Statistics
|
LEVEL TWO
Statistical investigation Conduct investigations using the statistical enquiry cycle:
Compare statements with the features of simple data displays from statistical investigations or probability activities undertaken by others. Probability Investigate simple situations that involve elements of chance, recognising equal and different likelihoods and acknowledging uncertainty. |
LEVEL THREE
Statistical Investigation Conduct investigations using the statistical enquiry cycle:
Evaluate the effectiveness of different displays in representing the findings of a statistical investigation or probability activity undertaken by others. Probability Investigate simple situations that involve elements of chance by comparing experimental results with expectations from models of all the outcomes, acknowledging that samples vary. |
LEVEL FOUR
Statistical Investigation Plan and conduct investigations using the statistical enquiry cycle:
Evaluate statements made by others about the findings of statistical investigations and probability activities. Probability Investigate situations that involve elements of chance by comparing experimental distributions with expectations from models of the possible outcomes, acknowledging variation and independence. |
LEVEL FIVE
Statistical Investigation Plan and conduct surveys and experiments using the statistical enquiry cycle:
Evaluate statistical investigations or probability activities undertaken by others, including data collection methods, choice of measures, and validity of findings. |
In this unit you will learn:
1) Graphs of Categorical Data
2) Graphs of Numerical Data
3) Statistical Literacy
4) The Enquiry Cycle
5) Analysis
6) Comparision Investigation (Multivariate)
7) Relationship Data (Bivariate)
1) Graphs of Categorical Data
2) Graphs of Numerical Data
3) Statistical Literacy
4) The Enquiry Cycle
5) Analysis
6) Comparision Investigation (Multivariate)
7) Relationship Data (Bivariate)
What is Statistics?

- The practice or science of collecting and analysing numerical data in large quantities, especially for the purpose of inferring proportions in a whole from those in a representative sample.
- Data can be collected in different ways:
- from the internet, books or public records - from people, either verbally or in writing
- by taking measurements
3. When writing a questionnaire, questions can be:
- open - the person filling in the questionnaire writes their own answers, e.g. their age
- closed - the person filling out the questionnaire chooses their answers from the options given, e.g. male or female
- Data is collected then recorded and sorted. Data can be recorded in a table or a tally chart.
- Data cards can help to sort data, to see patterns and draw conclusions about the data.
1) Graphs of Categorical Data
- Categorical data is data that can be grouped. For example, people's eye colours can be grouped into brown, blue, green and hazel.
- To graph categorical data we can use:
strip graphs, which show the proportion of each group in a line
pictograms, which use pictures to represent the frequency
bar graphs, in which each bar is one group and the heights of the bars represent the frequency of each group.
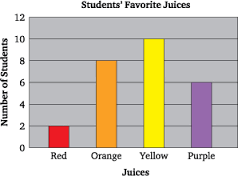
Bar Graph
|
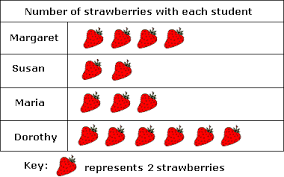
Pictogram
|
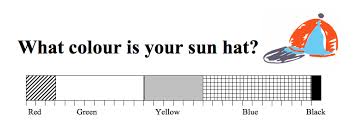
Strip Graph
|
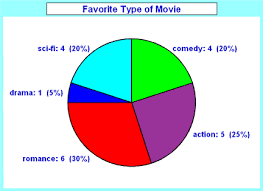
Pie Graph
|
2) Graphs of Numerical Data
Numerical data has number values
To graph numerical data we can use a:
To graph numerical data we can use a:
- dot plot, which dots to represent the frequency using a scale on the horizontal axis.
- stem and leaf plot, which shows the actual data in order
- time series graph, which has time on the horizontal axis
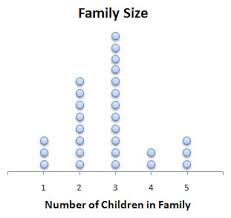
Dot Plot Graph
|
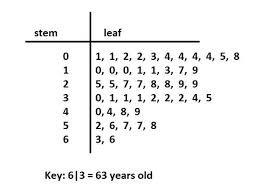
Stem and Leaf Graph
|
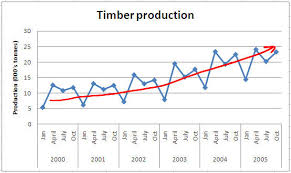
Time Series Graph
|
3) Statistical Literacy
When reading a graph, look at:
- the type of graph it is
- the title
- what the data represents
- what the features of the graph show about the data
|
LEVEL TWO
The key idea of statistical literacy at Level 2 is arguing from the data. |
LEVEL THREE
The key idea of statistical literacy at Level 3 is being a savvy consumer of data. |
LEVEL FOUR
The key idea of statistical literacy at NZC Level 4 is thinking beyond the data presented. |
LEVEL FIVE
The key idea of statistical literacy at NZC Level 5 is detecting flaws in the investigations of others. |
4) The Enquiry Cycle
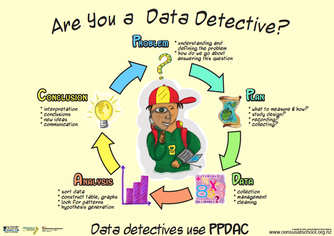
Statistical Enquiry Cycle
A cycle that is used to carry out a statistical investigation.
The cycle consists of five stages: Problem, Plan, Data, Analysis, Conclusion.
The cycle is sometimes abbreviated to the PPDAC cycle.
The problem section is about formulating a statistical question, what data to collect, who to collect it from and why it is important.
The plan section is about how the data will be gathered.
The data section is about how the data is managed and organised.
The analysis section is about exploring and analysing the data, using a variety of data displays and numerical summaries, and reasoning with the data.
The conclusion section is about answering the question in the problem section and giving reasons based on the analysis section.
Check out this fabulous websites on the ENQUIRY CYCLE
http://new.censusatschool.org.nz/resource/how-kids-learn-the-statistical-enquiry-cycle/
5) Analysis
|
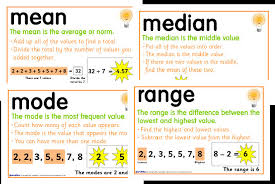
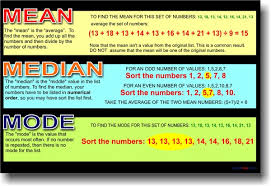
The MEAN is calculated by adding the values and then dividing this total by the number of values.
e.g 123, 134, 152, 117, 128 Add up all the above values and divide by the total of values. 123 + 143 + 152 + 119 + 128 = 665 655 divided by 5 = 133 The MEAN is 133. 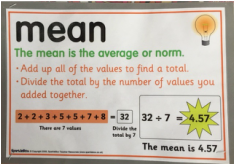
|
The MEDIAN is the middle value, when the values have been ordered from smallest to largest. If there is an even number of values, then add the two middle numbers together and divide the total by 2.
e.g 123, 134, 152, 117, 128 Put these values in order from smallest to largest. 117, 123, 128, 134, 152 The middle value is 128, so the MEDIAN is 128. 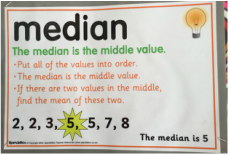
|
The MODE is the value that appears the most often in a set of data.
e.g 123, 134, 152, 117, 128, 134 The value that appears the most often in this set of data is 134, so the MODE is 134. 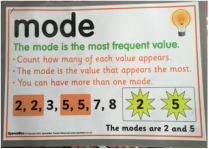
|
The RANGE is the difference between the lowest and the highest value.
e.g. 2,2,3,5,6,8 8 - 2 = 6 The RANGE is 6. 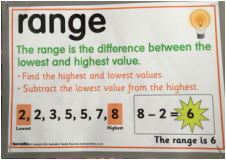
|
Games
Check out these MEAN, MEDIAN and MODE games. Click on the image and have some fun!
|
|
|
6) Comparision Investigation (Multivariate)
Let's look at this example and use OSEM to analyse it...
Shape
Median
Shift/Overlap
Spread
Special Features
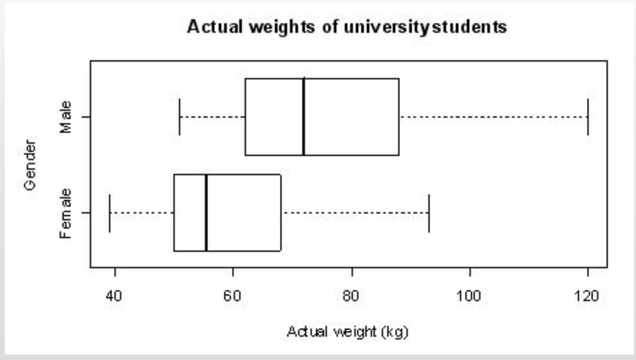
O obvious The shape of the graph for males and females is similar as there is hump on the left hand side of the graph. The median for the males is to the right of the females. The boxes overlap slightly for both. The spread is slightly more for males than females. One male student is well away from the rest
S specific Both graphs are right skewed as most of the data occurs on the left of the graph, on the lower end of the scale.The Median is higher for males than females . The bottom of the lower quartile for males overlaps the top of the upper quartile for females. The box plot for males is wider than the box plot for females. One student is much heavier than the other students sampled.
E evidence Most of the data for males occurs between 62 and 72kg whereas most of the data for females occurs between 51 and 56kg.
The median for the males is 72kg and the median weight for females is 56kg. The data overlaps between 62 and 68kg for male and female weight. The IQR for males is UQ88-LQ62 = 26kg and for females UQ68-LQ 51= 17kg. The minimum weight for males is 51kg and the maximum is 120kg for one male that was weighed within that sample (Outlier). The minimum weight for females is 39kg and maximum is 93kg.
M meaning Although there are males and females that weigh the same, males appear to be heavier than the females. There is more difference in male weights than female weights. The one student weighing much more than the rest may have been wearing too many clothes or may have just been a much bigger individual (rugby player!) with well developed muscles. This is what you would expect to find in a population of male and female students.
Shape
Median
Shift/Overlap
Spread
Special Features
O obvious The shape of the graph for males and females is similar as there is hump on the left hand side of the graph. The median for the males is to the right of the females. The boxes overlap slightly for both. The spread is slightly more for males than females. One male student is well away from the rest
S specific Both graphs are right skewed as most of the data occurs on the left of the graph, on the lower end of the scale.The Median is higher for males than females . The bottom of the lower quartile for males overlaps the top of the upper quartile for females. The box plot for males is wider than the box plot for females. One student is much heavier than the other students sampled.
E evidence Most of the data for males occurs between 62 and 72kg whereas most of the data for females occurs between 51 and 56kg.
The median for the males is 72kg and the median weight for females is 56kg. The data overlaps between 62 and 68kg for male and female weight. The IQR for males is UQ88-LQ62 = 26kg and for females UQ68-LQ 51= 17kg. The minimum weight for males is 51kg and the maximum is 120kg for one male that was weighed within that sample (Outlier). The minimum weight for females is 39kg and maximum is 93kg.
M meaning Although there are males and females that weigh the same, males appear to be heavier than the females. There is more difference in male weights than female weights. The one student weighing much more than the rest may have been wearing too many clothes or may have just been a much bigger individual (rugby player!) with well developed muscles. This is what you would expect to find in a population of male and female students.
7) Relationship Data (Bivariate)
Relationship (Bivariate)
|
The most AMAZING YouTube clip explaining Relationship Data and the Scatterplot Graph. Check it out...
|
|
