Systems of Equations
Objectives
M7-7 Form and use linear, quadratic, and simple trigonometric equations.
M7-8 Form and use pairs of simultaneous equations, one of which may be non-linear.
M7-7 Form and use linear, quadratic, and simple trigonometric equations.
M7-8 Form and use pairs of simultaneous equations, one of which may be non-linear.
|
Achievement
Apply systems of equations in solving problems involves:
|
Achievement with Merit
Apply systems of equations, using relational thinking, in solving problems involves one or more of:
|
Achievement with Excellence
Apply systems of equations, using extended abstract thinking, in solving problems involves one or more of:
|
Systems of Equations Assessment is an Internal Achievement Standard 91269 - 2 credits
Forming Equations
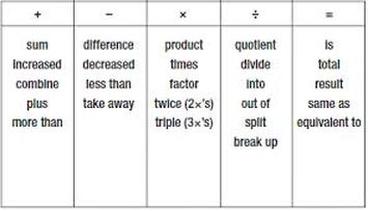
Part of this unit is being able to read a word problem, write an equation to represent the problem and solve it.
The following chart shows some words that may be used to represent the different mathematical operations.
Click on this link for practice : http://www.mathgoodies.com/lessons/vol7/equations.html
The following chart shows some words that may be used to represent the different mathematical operations.
Click on this link for practice : http://www.mathgoodies.com/lessons/vol7/equations.html
Solving Linear Simultaneous Equations
The solution to any two linear equations is where the two lines intersect. This can be found by:
A) Graphing (by hand or on a graphics calculator)
B) Algebraically
A) Graphing (by hand or on a graphics calculator)
B) Algebraically
A) Graphing
There are three methods to graphing a line:
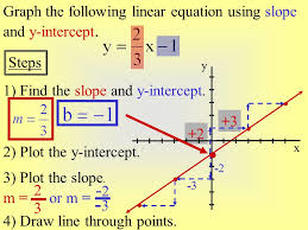
1) gradient - y intercept form: y = mx + c
This is when each equation is solved for y (or another variable). To graph the line, start with the y - intercept (c). From there, use the gradient to count how many to rise and how many to run.
Once both lines are graphed, the intersection point can be read off the graph.
There are three methods to graphing a line:
1) gradient - y intercept form: y = mx + c
This is when each equation is solved for y (or another variable). To graph the line, start with the y - intercept (c). From there, use the gradient to count how many to rise and how many to run.
Once both lines are graphed, the intersection point can be read off the graph.
|
|
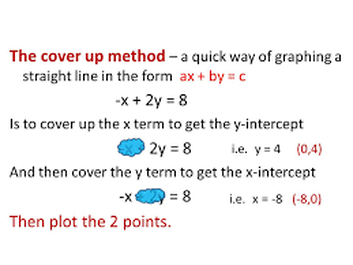
2) Cover up Method
This method involves finding the x and y intercepts of the line and graphing these two points.
Once both lines are graphed, the intersection point can be read off the graph.
This method involves finding the x and y intercepts of the line and graphing these two points.
Once both lines are graphed, the intersection point can be read off the graph.
|
|
3) Using a Graphics Calculator
Follow the steps below to graph two lines and find their intersection point.
Try the following example: Find the intersection point of y = 3x + 1 and x + y = 2
Follow the steps below to graph two lines and find their intersection point.
- Press the menu button and choose the graphs menu
- Enter the first equation into Y1 and press EXE (Note it must be in the form y = mx + c)
- Enter the second equation into Y2 and press EXE (Note it must be in the form y = mx + c)
- Press DRAW (F6) to draw the lines (you may need to adjust the window if you can't see the intersection point).
- Press G-Solv (F5) and then ISCT (F5) to find the intersection point
- The answer is at the bottom of the screen written as x = ??????? and y = ???????? which is written as a coordinate (x,y)
Try the following example: Find the intersection point of y = 3x + 1 and x + y = 2
- Get to the graphs menu
- Enter 3x + 1 into Y1 and press EXE
- Rearrange the second equation to read y = -x + 2.
- Enter -x + 2 into Y2 and press EXE
- Press DRAW (F6), G -Solv (F5) and ISCT (F5)
- The answer is x = 0.25, y = 1.75 which is written as (0.25, 1.75)
B) Algebraically
